Why one MIS is so hard to produce
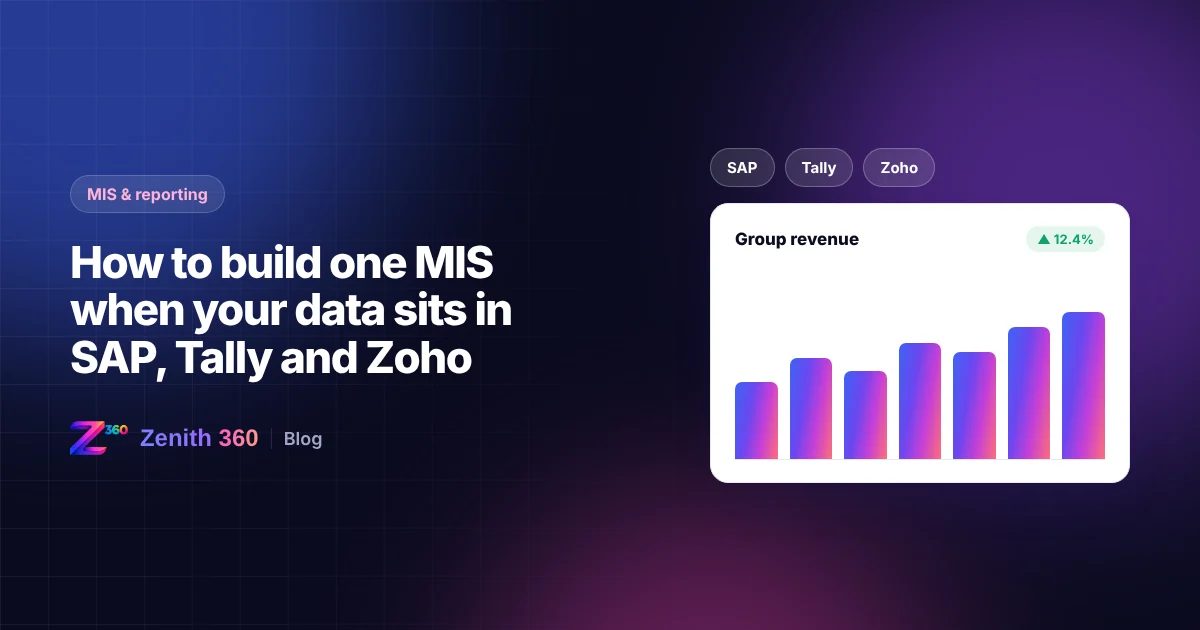
It is common for an Indian business to run on more than one system. The parent company may use SAP, a newer subsidiary Tally, and the sales team Zoho. Each system produces good reports of its own. None of them can show the whole business.
So every month, someone exports data from each system, pastes it into a workbook, adjusts it and builds the MIS by hand. It works, but it takes days, depends on one or two people, and leaves management looking at numbers that are already weeks old.
The difficulty is not the exports. It is that each system describes the business differently:
- Different charts of accounts. "Sales - Domestic" in one system may be three ledgers in another.
- Different masters. The same customer or item has a different code, or a slightly different name, in each system.
- Different cut-offs. One entity closes its books on the 5th, another on the 12th.
- Inter-company entries that must be eliminated before the figures are combined.
Start with the decisions, not the data
Before connecting any system, agree what the MIS is for. A useful MIS answers the questions management actually asks every month. For most businesses, that means:
- profit and loss by entity, business line and month, against budget and last year
- cash position and cash flow forecast
- receivables and payables ageing, with the largest overdue items named
- sales by customer, product and region, with margins
- key operational figures, such as production, stock or headcount
Anything that does not support a decision can wait. A short MIS that arrives on the 3rd is worth more than a long one that arrives on the 20th.
A practical way to build it
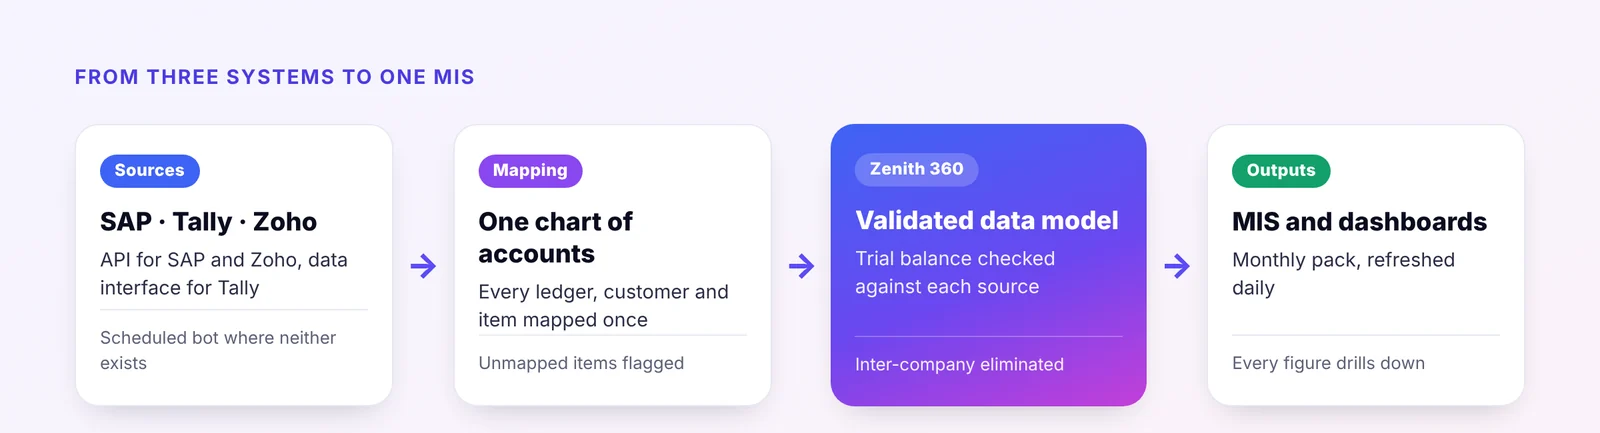
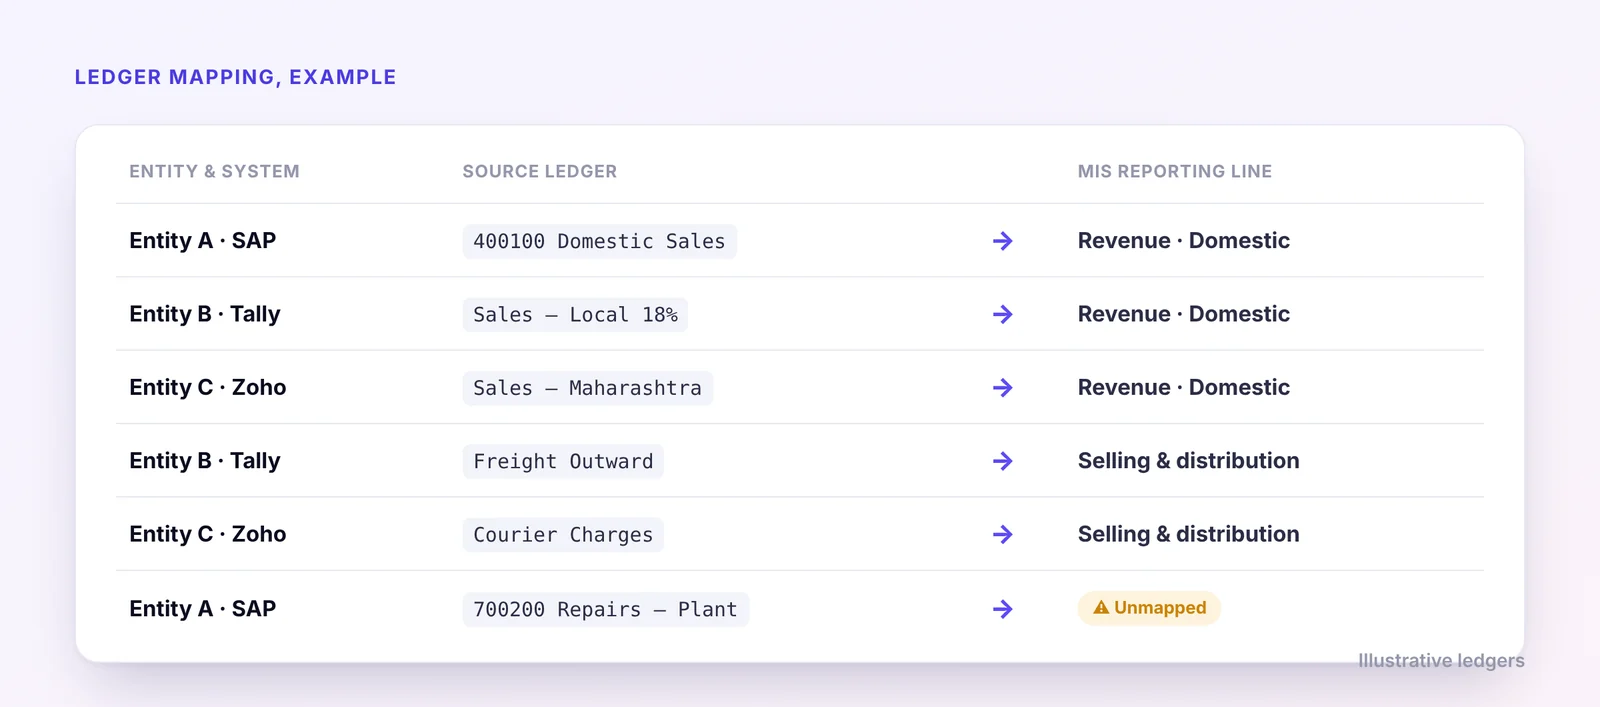
- Build one reporting chart of accounts. Define the lines the MIS will report on, then map every ledger in every system to one of those lines. This map is the most important document in the whole exercise.
- Map the masters. Link customers, vendors, items and cost centres across systems to a single code. Start with the largest customers and items, which cover most of the value.
- Choose how to extract the data. Use an API where the system offers one, as Zoho and SAP do. Use the available data interface for Tally. For systems with neither, a scheduled bot can export the reports a person would otherwise download.
- Validate every load. For each entity and month, the trial balance in the MIS must match the trial balance in the source system. Any difference is flagged before anyone sees a report.
- Eliminate inter-company transactions using the mapping, so that group figures are not inflated.
- Refresh on a schedule. Daily refreshes are usually enough, and make the MIS useful during the month, not only after it.
- Allow drill-down. Every figure should open into the ledgers and transactions behind it. This is what makes management trust the numbers.
Key point The trial balance check in step 4 is what turns a dashboard into an MIS. If the figures do not tie back to the books, people go back to their spreadsheets.
Common mistakes
- Mapping once and never again. New ledgers and items are created every month. The mapping needs an owner and an exceptions list of anything unmapped.
- Building every possible report first. Start with the monthly pack management already uses, then add analysis once people rely on it.
- Hiding the source. If no one can see where a number came from, the first wrong-looking figure undermines the whole report.
- Copying data back into Excel. If the MIS is exported and edited before it reaches management, the manual work and the errors come back.
What changes once it works
When the MIS is fed directly from the source systems, the monthly pack is ready within days of the books closing, rather than weeks. Finance teams stop assembling numbers and start explaining them. And because the same data model sits underneath, new questions can be answered from existing data instead of a new spreadsheet.
How Zenith 360 helps
Zenith 360 works as the layer between your systems. It connects to SAP, Tally and Zoho, applies the ledger and master mappings, checks every load against the trial balance and presents the MIS as live dashboards with drill-down. Read how this worked for a business on Tally and Zoho in our case study, or see our MIS and analytics service.

Aniruddha has spent more than ten years in finance, tax and business systems for Indian companies, and founded Z360 Systems to automate the work finance teams still do by hand. More about Aniruddha